Debugging
Ad Inserter has many debugging functions that can help you to diagnose the problem when you don’t see your ads at expected positions or when you experience issues that might be related to the code inserted by the plugin. There are two ways to debug issues: front-end debugging and back-end debugging.
Check How Ad Inserter works to understand how ads are displayed and how code is inserted.
Front-end debugging
Front-end debugging is mainly used to visualize inserted blocks, positions for automatic insertion or HTML tags and to debug insertions – when you don’t see blocks at expected positions.
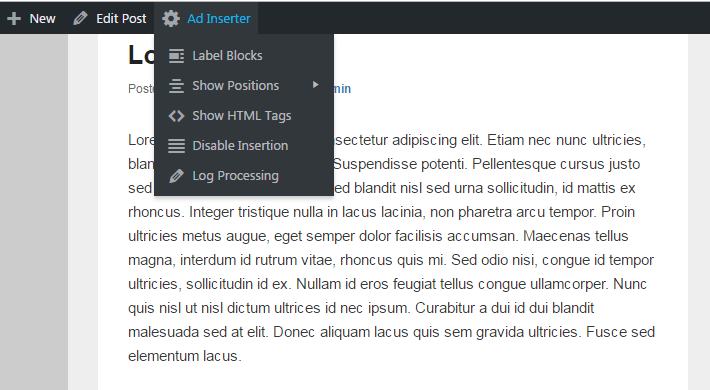
When you are logged in as administrator each post and page has a WordPress admin toolbar on the top with Ad Inserter menu item. If you don’t see it check WordPress Users > Your profile and make sure Show Toolbar when viewing site is checked. Check also Ad Inserter plugin settings (tab ⚙ / Debugging) and make sure Debugging functions in admin toolbar is checked.
Make sure caching is disabled while debugging!
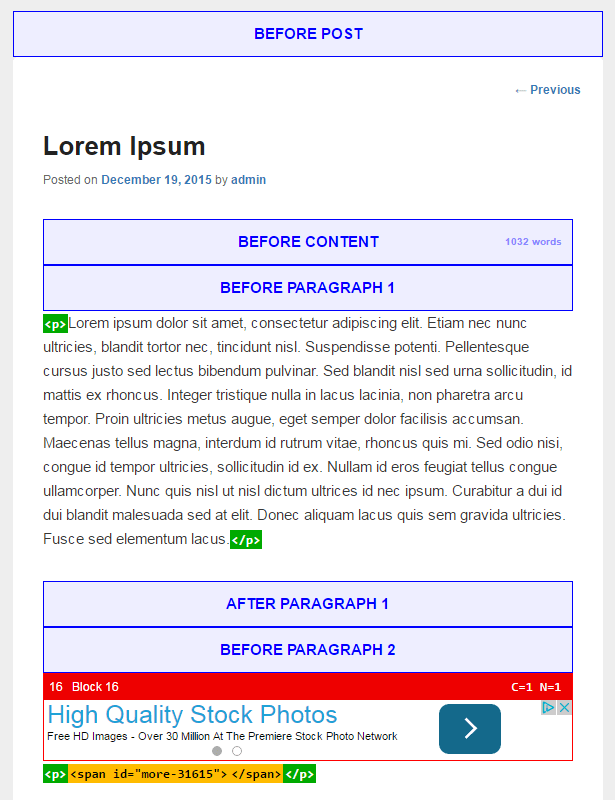
Example of page with enabled debugging functions Label Blocks, Show Positions and Show HTML tags:
Debugging Tools widget
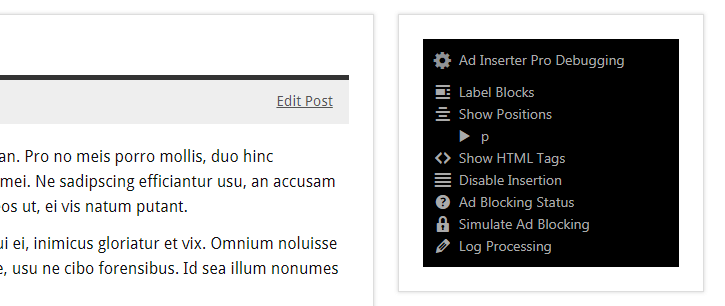
It may happen that your theme does not not support the toolbar or it is not displayed for some other reason. In such case you can use Ad Inserter Debugging Tools widget which has the same menu items. Simply drag Ad Inserter widget into the sidebar and select Debugging Tools. Of course, you still need to be logged in as administrator to see the widget.
Debugging functions
Label Blocks
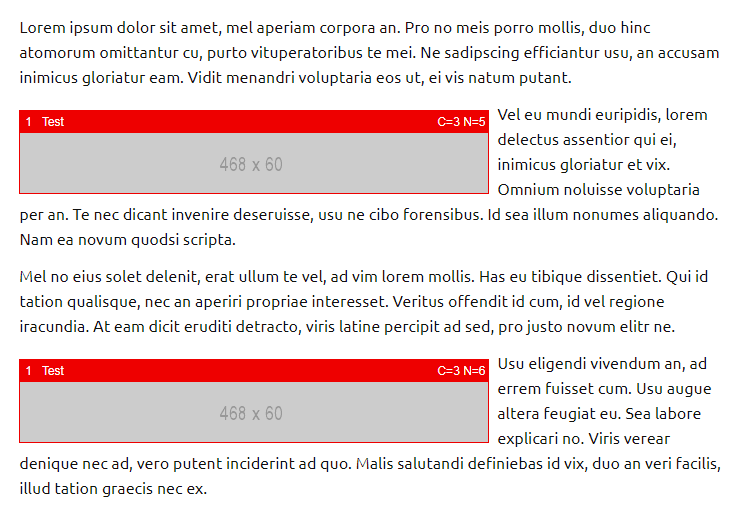
Each inserted block is labeled with a thin red border and colored bar with block number, block name (including rotation option name if rotation is used), viewport name if using client-side device detection and counters. If you see only block label then this means that the block with your code is inserted but the code doesn’t display anything.
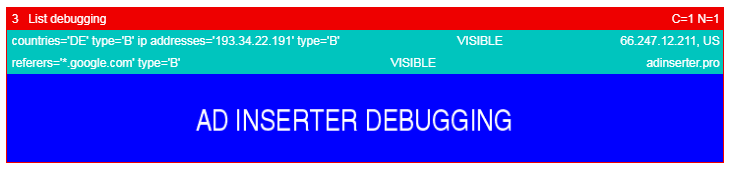
When you are using client-side dynamic blocks, debugging function Label blocks also shows referrer, IP address or country data for each block that has Referrers, IP addresses or Countries list set.
Label colors
- Normal block
- Hidden block because of client-side device detection
- Block with AMP separator on AMP page
- Header and footer code, client-side insertion scripts
- Block with ad blocking action
- Ad blocking replacement block, scheduling fallback block
- Block with client-side black or whitelist check
- Block with client-side cookie check
- Block in Ajax request
- iframe block
- Not inserted block because of W3TC checks
- AdSense Auto ads
- AdSense ads with no slot size
Label counters
Each labeled block shows also various counters that can be used for filtering of insertions. Available counters:
- N = Block counter
- C = Content processing (
the_content) counter - X = Excerpt processing (
the_excerpt) counter - B = Before post (
loop_start) counter - A = After post (
loop_end) counter - W = Widget counter for this block
- P = PHP function call counter for this block
Ad Inserter supports also shortcodes for these counters. The shortcode returns the number which corresponds to the specific counter:
-
[ADINSERTER counter="block"]– insertion counter for this block -
[ADINSERTER counter="content"]– counter forthe_contentfilter calls -
[ADINSERTER counter="excerpt"]– counter forthe_excerptfilter calls -
[ADINSERTER counter="before-post"]– counter forloop_starthook calls -
[ADINSERTER counter="after-post"]– counter forloop_endhook calls -
[ADINSERTER counter="widget"]– counter for widgets for current block -
[ADINSERTER counter="php"]– counter for PHP function calls for current block
If you are using shortcode inside string enclosed with double quotes you need to use single quotes for shortcode attributes, for example [ADINSERTER counter='block']
Show Positions
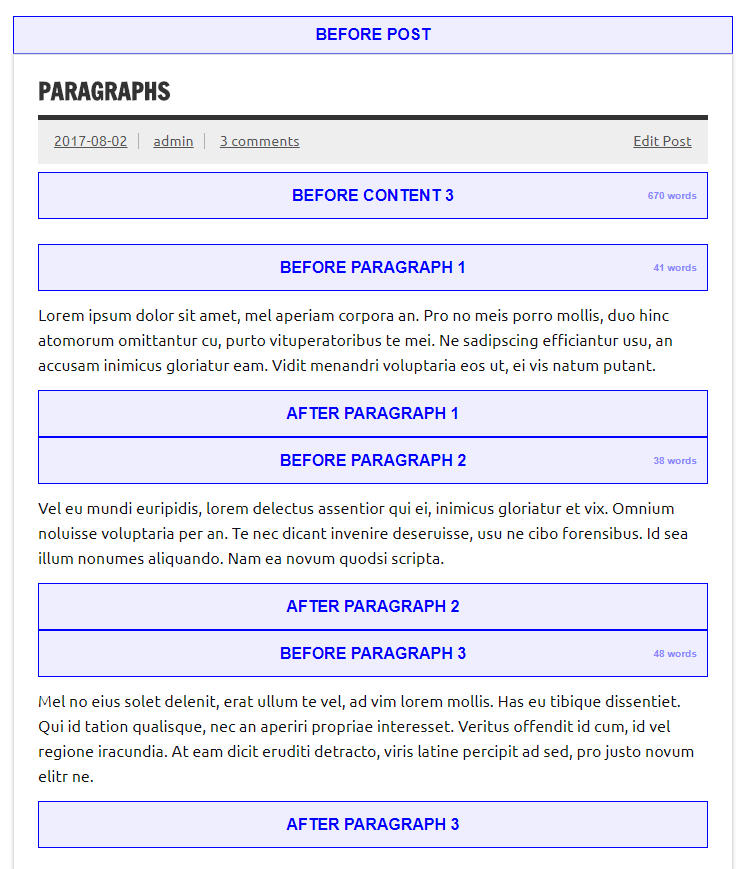
Debugging function Show Positions labels every available position for automatic insertion that is supported by the theme.
All paragraph positions are shown according to the selected paragraph counting settings (Show Positions sub-menu) and show paragraph number and number of paragraph words.
All other positions show also processing counter (hook call counter) unless it is 1 (the first call). You can use this number for insertion filtering.
Show HTML tags
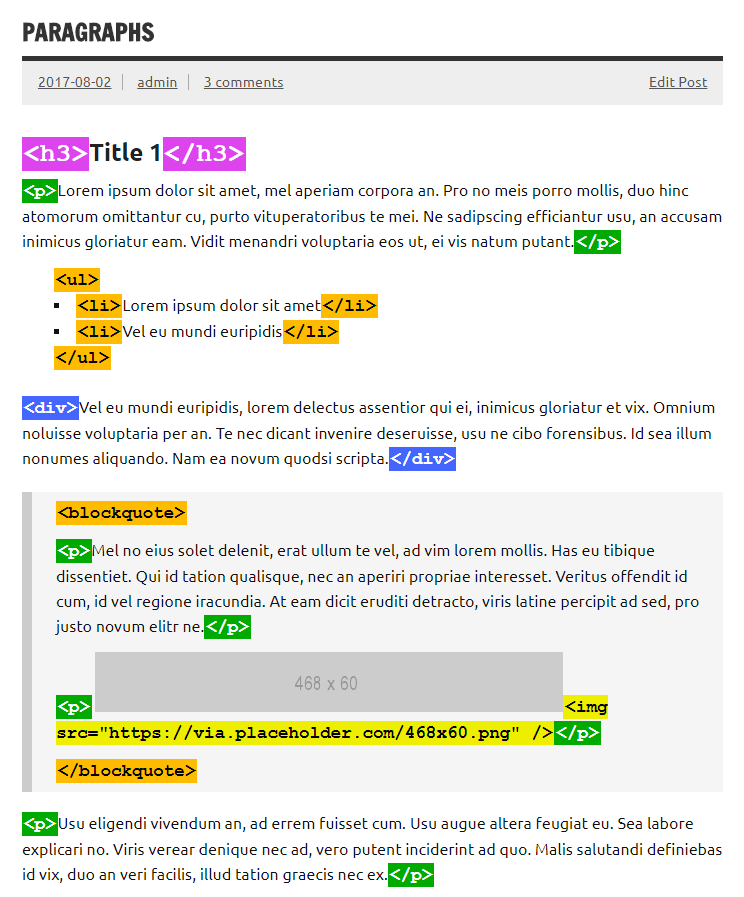
Debugging function Show HTML tags labels most HTML tags that are important to determine parameters for paragraph counting.
Disable insertion
Use this function to temporarily disable insertion of code blocks – everything else on the page will look like the code blocks were processed and inserted.
Ad Blocking Status
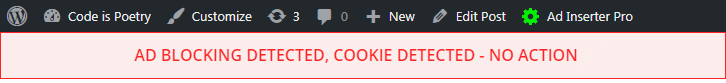
When this function is enabled you will see a bar below the toolbar showing the status of ad blocking detection: whether ad blocking is detected, whether action is enabled, whether action cookie is present and how many page views were already counted (if used). You can click on the bar to delete ad blocking detection cookies. Ad blocking detection needs to be enabled to use this function.
Simulate Ad Blocking
With this function you can simulate and test ad blocking detection without actual ad blocking software. Ad Inserter will behave as there is ad blocking present. Of course, no ads will be blocked, only plugin ad blocking functions will be triggered when the page is loaded. Ad blocking detection needs to be enabled to use this function.
Log Processing
Use this function to log insertion process in order to determine why some code block was not inserted. The log is added as HTML comment at the end of the page – check page source.
Processing Log Widget
Place Processing Log widget into some widget area or sidebar to see insertion process including basic WordPress page and Ad Inserter data (User status, Page Type, Post ID, Url, Referrer, etc). With this widget you can also check saved block settings and client-side viewport name. Example of Log Processing debugging function and processing log shown in the widget:
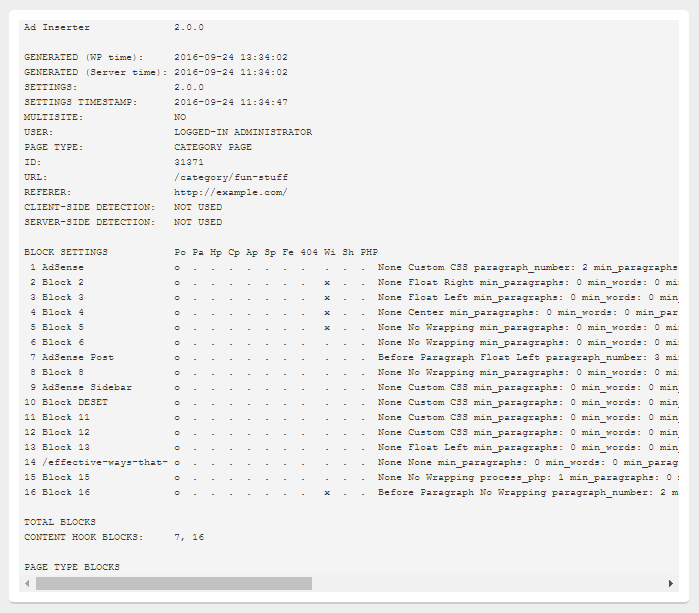
More detailed processing log with detailed debugging info is shown as HTML comment at the bottom of page source.
Code Preview
Click on the Preview button below code editor for each code block to see how the ad or code will look like. On the preview window click on the Highlight button to highlight the code. If you don’t see anything displayed here it is very likely that the code is not working properly. Here you can also adjust alignment and style for code block. Of course, blank AdSense blocks are a common issue – it may happen that AdSense code will not display ads in the preview window.
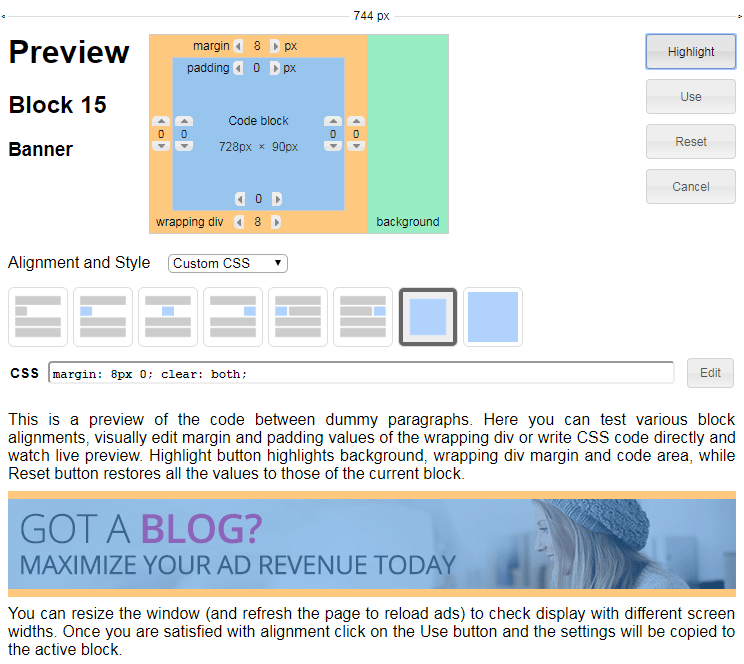
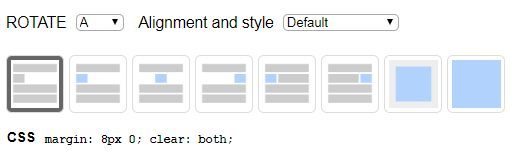
When the code contains shortcode separators (CHECK, COUNT or ROTATE) you’ll see additional selections before Alignment selection to select the code for preview.
General debugging information
Make sure caching is disabled while debugging!
All front-end debugging functions you enable will be visible only to you unless you enable Remote debugging and other users use debugging url parameters on your website. Post/page debugging works by adding url parameters to the url (web address). Debugging settings are also stored into cookie. The following url parameters are available:
- Label Blocks:
ai-debug-blocks=1(useai-debug-blocks=0to turn it off) - Show Positions:
ai-debug-positions=BLOCK_NUMBER, 0 means default counting of paragraphs withptags, number means block number to see paragraph counting as configured for the block (useai-debug-positions=to turn it off) - Show HTML tags:
ai-debug-tags=1(useai-debug-tags=0to turn it off) - Show block code:
ai-debug-code=1(useai-debug-code=0to turn it off) - Disable insertion:
ai-debug-no-insertion=1(useai-debug-no-insertion=0to turn it off) - Log Processing:
ai-debug-processing=1(useai-debug-processing=0to turn it off) - PRO Country test:
ai-debug-country=XX(replace XX with country ISO Alpha-2 code) - PRO IP address test:
ai-debug-ip-address=IP_ADDRESS - Ad blocking simulation:
ai-debug-adb=1(useai-debug-adb=0to turn it off) - Ad blocking detection status:
ai-debug-adb-status=1(useai-debug-adb-status=0to turn it off)
Country test and IP address test work only when you have enabled debugging on some page and debugging cookie is created (for example, when you enable function Label blocks).
When browsing other pages on the website debugging settings are temporarily saved (for the session). To disable all debugging functions click on the Ad Inserter top menu item in the toolbar (or use url parameter ai-debug=0)
If you see only block label (bar with block name) then this means that the block with your code is inserted but the code doesn’t display anything.
Back-end debugging
In some cases when you are using the plugin to insert ad codes you may experience various issues, slow page loading or ads you don’t recognize. In such case you should not blame Ad Inserter as it only inserts your ad codes. Please note that if you configure a block with some JavaScript ad code, then this code may insert some additional code or show ads. But please, don’t blame the plugin for this 🙂 You can also use Ad Inserter to insert code for AdSense Auto ads on each page (usually in the header). However, the exact placement of ads will be done by the ad code, not Ad Inserter!
Please note that when you disable Ad Inserter you also disable insertion of all codes and blocks you have configured. Therefore, if your issues go away when you disable the plugin THIS DOES NOT INDICATE any issue with the plugin! You need to try to disable individual codes to see which one is causing trouble.
In order to quickly diagnose which code is responsible for the issue Ad Inserter provides functions to temporarily disable insertions of the codes inserted by the plugin. This is mostly your codes you put into blocks with some additional HTML, CSS and JavaScript code needed for debugging, alignment, client-side detection or insertion.
In most cases when you’ll disable code for header, footer and all blocks, your issues should disappear. This indicates that the issues were caused by your code you put into Ad Inserter blocks. If you are using PHP code you can also enable blocks and disable PHP processing (for all blocks). This will help you diagnose PHP code that may be slowing your website – check also section Heavy website load for additional information.
If the website can’t be loaded because of errors in your PHP code you can disable PHP processing by defining a constant, for exampe in wp-config.php file:
define ('AI_NO_PHP_PROCESSING', true);
You can also disable other CSS and JavaScript codes generated by the plugin for debugging, alignment, client-side detection or insertion purposes. When you disable all insertions, the plugin is still active and working, it only does not insert anything. So you can easily diagnose which code is causing you issues.
Back-end debugging can be used to individually disable insertion of everything Ad Inserter inserts into your website: Heder code (tab Header), Footer code (tab Footer), JavaScript code, CSS code, PHP code and code for all blocks. Settings are located on plugin settings tab ⚙ / tab Debugging
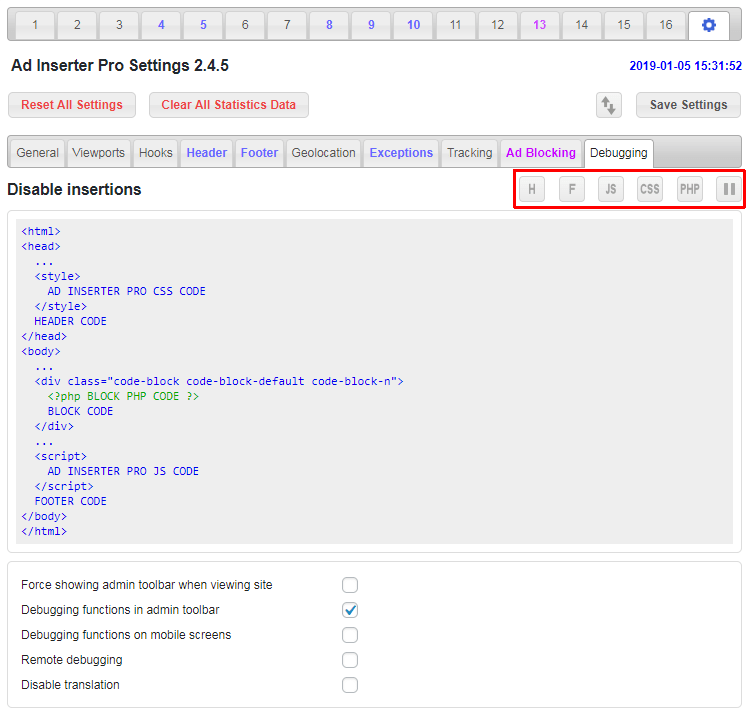
H – Header code
This button disables your header code (code Ad Inserter inserts in the <head> section) – tab ⚙ / tab Header
F – Footer code
This button disables your footer code (code Ad Inserter inserts before </body> tag) – tab ⚙ / tab Footer
JS – plugin JavaScript code
This button disables any JavaScript code Ad Inserter inserts in addition to enabled blocks: js code for debugging, client-side detection or client-side insertion.
CSS – plugin CSS code
This button disables any CSS code Ad Inserter inserts in addition to enabled blocks: css code for debugging, client-side detection or client-side insertion.
PHP – PHP code processing
This button disables processing of PHP code for all blocks. You can also individually disable PHP processing for each block. When PHP code processing is disabled, any PHP code in the block will be inserted as HTML code.
II – Code for blocks
This button disables (pauses) insertion of all blocks. You can also individually disable (pause) insertion for each block.
Global debugging settings
Global debugging settings are located on plugin settings tab ⚙ / tab Debugging
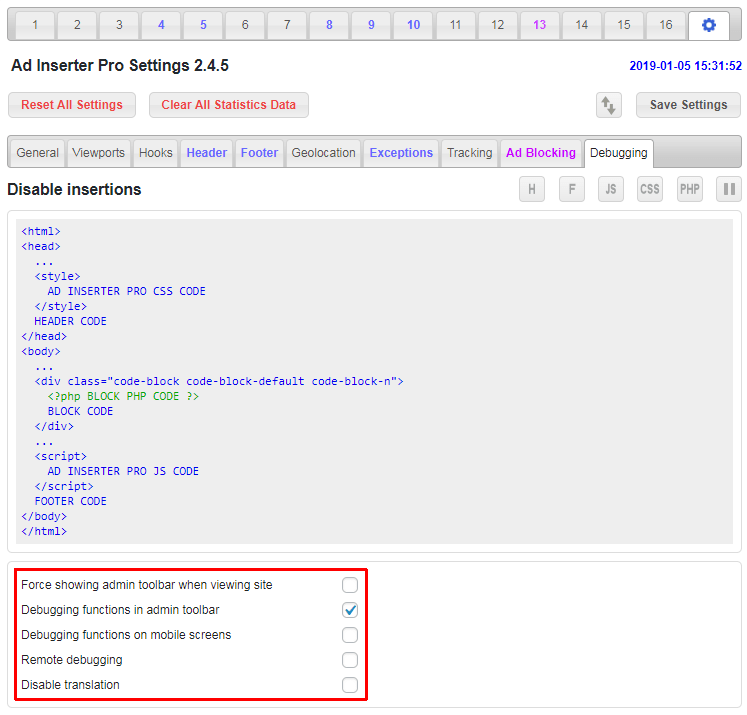
When you are logged in as administrator each post or page has a WordPress admin toolbar on the top with Ad Inserter menu item – Ad Inserter functions for front-end debugging.
If you don’t see admin toolbar on the top go to WordPress Users > Your profile and make sure Show Toolbar when viewing site is checked. If you don’t see admin toolbar you can try to enable Force showing admin toolbar when viewing site.
Make sure Debugging functions in admin toolbar is checked (there is a separate settings Debugging functions on mobile screens for admin toolbar on mobile screens). This option will add Ad Inserter debugging menu with debugging functions.
Remote debugging enables other people using url parameters to see your pages with debugging data: debugger widget, labeled blocks, positions for automatic insertion, labeled tags and processing log. For logged in administrators debugging is always enabled.
Enable this option to allow other people to see debugging data in order to help you to diagnose issues with Ad Inserter.
When you are not using English as WordPress language and your language is supported by Ad Inserter, all the texts the plugin generates will be shown in your language. When you check Disable translation it will disable translation of plugin texts and show them in English.
Install Ad Inserter for free
Ad Inserter Pro Affiliate Program
